Cranfield Log
Project Overview
The Bureau of Economic Geology Gulf Coast Carbon Center is currently conducting a $34 million multi-year field study of sequestration and monitoring strategies for long-term storage of carbon dioxide. This work is being performed in conjunction with the Southeast Regional Carbon Sequestration Partnership (SECARB) with support from the National Energy Technology Laboratory (NETL) and the U.S. Department of Energy (DOE) and managed by the Southern States Energy Board (SSEB).
Planning for the project began in November 2006 and we are now reaching the point where data collection begins. The project involves numerous industrial partners, scientific collaborators, and technical subcontractors, each of whom is responsible for different aspects of the study:
- The Gulf Coast Carbon Center is responsible for geologic characterization, monitoring design, integration, and near-surface monitoring.
- Denbury Resources, Inc. is the site host. They are also responsible for the well preparation and will supply the CO2 for storage and sequestration.
- Sandia Technologies LLC is responsible for subsurface monitoring systems design and deployment.
- Schlumberger Carbon Services will perform wireline logging and interpretation.
- Lawrence Berkeley National Lab is responsible for cross-well, VSP and Continuous Active Seismic Source Monitoring (CASSM). Implementation and evaluation of of noble gas and other tracers and the U-tube and Distributed Temperature System (DTTS).
- Lawrence Livermore National Labs and Promore will perform cross well Electrical Resistance Tomography (ERT).
- University of Mississippi and Mississippi State University are responsible for groundwater monitoring.
Our aim in presenting this log of real-time updates about the project is to document our research, which is one step in the progress toward developing a process for safe, long-term, subsurface sequestration of carbon. We are aware that our work will involve successes as well as practical problems that must be overcome along the way. No other project in the United States has incorporated so many different geological and technical measurements and we expect to accumulate significant information and experience that will increase confidence and decrease costs of future geologic carbon sequestration projects.
View a high-level overview of the project and its accomplishments in the U.S. Department of Energy's Carbon Storage Atlas Fifth Edition (2015), starting on page 50.
The Study Site
The site for the project is Denbury Resources Cranfield Field in southwest Mississippi. Cranfield field, Mississippi, was discovered in 1946 and abandoned in 1965 at the end of primary oil and gas production. Denbury Resources, Inc. currently operates the field and is a partner in the study.
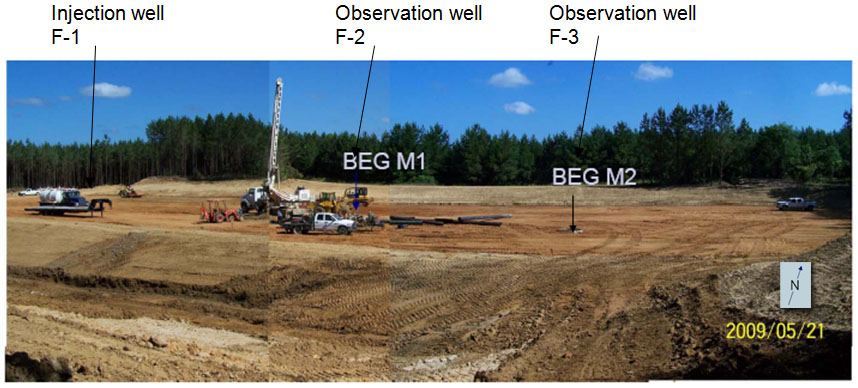
The study site in Cranfield field, MS includes an injection well and two observation wells. The detailed area of study (DAS) includes three wells. The westernmost well (F-1) is operated by Denbury and is the site of injection of carbon dioxide into the subsurface geologic reservoir. Two observations wells are approximately 300 ft and 400 ft to the southeast and are referred to as F-2 and F-3, respectively. The observation wells will be equipped with state-of the-art monitoring systems that will track and monitor the carbon dioxide plume as it moves through the reservoir more than 10,000 feet below the surface.
Summary of Project Successes
The SECARB “early” test at Cranfield is reviewed in a number of papers and a select categorized list is included below. Papers from relevant GCCC-led projects by non-GCCC authors and relevant papers from before 2011 are also included for convenience.
Overviews of the SECARB project
Hovorka, S. D., 2013, Three-million-metric-ton-monitored injection at the SECARB Cranfield project—project update: Energy Procedia, v. 37, p. 6412–6423 DOI information: 10.1016/j.egypro.2013.06.571
Hovorka, S. D., Choi, J.-W., Meckel, T. A., Treviño, R. H., Zeng, H., Kordi, M., Wang, F. P., and Nicot, J.-P., 2009, Comparing carbon sequestration in an oil reservoir to sequestration in a brine formation—field study, in Energy Procedia (v. 1, no. 1), Proceedings of 9th International Conference on Greenhouse Gas Control Technologies GHGT9, November 16–20, Washington, D.C., p. 2051–2056.
Hovorka, S. D., Meckel, T. A., and Nicot, J-.P., 2013 Mid-project assessment of the SECARB early test at Cranfield, Mississippi: International Journal of Greenhouse Gas Control.
Hovorka, S. D., Meckel, T. A., and Treviño, R. T, 2013, Monitoring a large-volume injection at Cranfield, Mississippi— project design and recommendations: International Journal of Greenhouse Gas Control, v. 18, p. 345–360, http://dx.doi.org/10.1016/j.ijggc.2013.03.021.
Hovorka, S. D., Meckel, Timothy, Treviño, R. H., Lu, Jiemin, Nicot, J.-P., Choi, Jong-Won, Freeman, D., Cook, P. G., Daley, Tom, Ajo-Franklin, J., Freifeld, Barry, Doughty, C. A., Carrigan, C. R., La Brecque, D., Kharaka, Yousif, Thordsen, J. J., Phelps, Tommy, Yang, Changbing, Romanak, Katherine, Zhang, Tongwei, Holt, R. M., Lindler, J. S., and Butsch, R. J., 2011, Monitoring a large volume CO2 injection: year two results from SECARB project at Denbury's Cranfield, Mississippi, USA, in Energy Procedia, v. 4, Proceedings of 10th International Conference on Greenhouse Gas Control Technologies GHGT10, September 19 23, Amsterdam, The Netherlands, p. 3478–3485.
Hovorka, S. D., Meckel, T. A., Treviño, R. H., Nicot, J. –P., Choi, J. –W., Yang, C., Paine, J., Romanak, K., Lu, J., Zeng, H., and Kordi, M., 2009, Southeast Partnership Early Test Update – Cranfield field, MS: presented at the Eighth Annual Conference on Carbon Capture and Sequestration, Pittsburgh, Pennsylvania, May 4-7, 2009.
Characterization
Reservoir, regional seal, overburden, groundwater and the near surface were characterized using published field history, historic and current production data, a 2007 3-D seismic survey prior to CO2 injection, historic and modern wireline logs, 4 cores, published and newly collected groundwater data, and airborne surveys.
Kordi, Masoumeh, 2013, Characterization and prediction of reservoir quality in chlorite-coated sandstones: evidence from the Late Cretaceous Lower Tuscaloosa Formation at Cranfield Field, Mississippi, U.S.A., PhD Dissertation, the University of Texas at Austin, 193p.
Lu, Jiemin. Kordi, Masoumeh, Hovorka, S.D. , Meckel, T.A., Christopher, C.A, 2013., Reservoir characterization and complications for trapping mechanisms at Cranfield CO2 injection site. Int. J. Greenhouse Gas Control (2012), http://dx.doi.org/10.1016/j.ijggc.2012.10.007
Lu, Jiemin, Milliken, K., Reed, R. M., and Hovorka, S. D., 2011, Diagenesis and sealing capacity of the middle Tuscaloosa mudstone at the Cranfield carbon dioxide injection site, Mississippi: Environmental Geosciences, v. 18, no. 1, p. 35–53.
Time lapse (4D) seismic survey
A second 3D survey was collected over part the area that had been flooded with CO2 after two years of CO2injection. A 3D VSP was also conducted under funding from NRAP.
Carter, R.W., Spikes, K.T., 2013, Sensitivity analysis of Tuscaloosa sandstones to CO2 saturation, Cranfield field, Cranfield, MS. Int. J. Greenhouse Gas Control (2013), http://dx.doi.org/10.1016/j.ijggc.2013.01.006
Daley, T.M., Henderickson, Joel, and Queen, in press, Analysis of Time-Lapse Offset VSP For Monitoring of CO2 Storage at Cranfield, MS, SEG.
Daley, T.M., Ajo-Franklin, J.B., Doughty, C., Hovorka, S., 2010, Seismic monitoring and reservoir modeling at SECARB's Phase-III Cranfield Site, Ninth Annual Conference on Carbon Capture and Sequestration, Pittsburgh, May 10-13, 2010.
Ditkof, J., Caspar E, Pevzner, R., Urosevic, M., Meckel, T. A., Hovorka, S. D., in press, Time lapse seismic signal analysis for EOR and CCS site, Cranfield field, Mississippi, Geophysics.
Ditkof, Julie N., 2013, Time-lapse seismic monitoring for enhanced oil recovery and carbon capture and storage field site at Cranfield field, Mississippi, University of Texas Jackson School of Geosciences Master's thesis;http://hdl.handle.net/2152/23200
Zhang, R., Ghoshe, Ranjana, Sen, M. K, Srinivansan, Sanjay, 2013, Time-lapse surface seismic inversion with thin bed resolution for monitoring CO2 sequestration: A case study from Cranfield, Mississippi. Int. J. Greenhouse Gas Control (2012), http://dx.doi.org/10.1016/j.ijggc.2012.08.015.
Zhang, Rui, Song, Xiaolei, Fomel, Sergey, Sen, Mrinal, Srinivasan, Sanjey, in press, Time-lapse pre-stack seismic data registration and inversion for CO2 sequestration study at Cranfield.
Well-based monitoring program
Imaging of a segment of the flood with high spatial and temporal resolution was accomplished using many technologies at the Detailed Area Study (DAS) where two observation wells were placed in a 100m transect downdip of an injection well in the water leg of the reservoir.
Ajo-Franklin, J.B., Peterson, J, Doetsch, J., Daley, T.M., 2013, High-resolution characterization of a CO2 plume using crosswell seismic tomography: Cranfield, MS, USA., Int. J. Greenhouse Gas Control (2013),http://dx.doi.org/10.1016/j.ijggc.2012.12.018
Butsch, Robert, Brown, A. L., Bryans, Bradley, Kolb, Conrad, Hovorka, Susan, 2013, Integration of well-based subsurface monitoring technologies: Lessons learned at SECARB study, Cranfield, MS, Int. J. Greenhouse Gas Control
Carrigan, C.R., Yang, Xianjin, LaBrecque, D. J., Larson, Dennis, Freeman, David, Ramirez, A. L., Daily, William, Aines, Roger, Newmark, Robin, Friedmann, Julio, Hovorka, Susan, 2013, Electrical resistance tomographic monitoring of CO2 movement in deep geologic reservoirs. Int. J. Greenhouse Gas Control (2013),http://dx.doi.org/10.1016/j.ijggc.2013.04.016
Dodds, Kevin, Krahenbuhl, Richard, Reitz, Anya, Li, Yaoguo, Hovorka, Susan, 2013, Evaluation of time lapse borehole gravity for CO2 plume detection SECARB Cranfield . Int. J. Greenhouse Gas Control (2013)
Doetsch, Joseph, Kowalsky, M. A. Doughty, Christine, Finsterle , Stefan, Ajo-Franklin, J. B., Carrigan, C. R., Yang, Xianjin, Hovorka, S. D., Daley, T. M., 2013, Constraining CO2 simulations by coupled modeling and inversion of electrical resistance and gas composition data. Int. J. Greenhouse Gas Control (2013),http://dx.doi.org/10.1016/j.ijggc.2013.04.011
Fluid-flow models
A series of fluid flow models were constructed to assess the response of the reservoir.
Chang, K.-W., Hesse, M. A., Nicot, J. -P., and Hovorka, S. D., 2011, Effects of adjacent mud rocks on CO2 injection pressure: model case based on a typical U.S. Gulf Coast salt diapir field under injection, in Energy Procedia, v. 4, Proceedings of 10th International Conference on Greenhouse Gas Control Technologies GHGT10, September 19–23, Amsterdam, The Netherlands, p. 4567–4574.
Choi, Jong-Won, Nicot, J. -P., Meckel, Timothy, and Hovorka, S. D., 2011, Numerical modeling of CO2 injection into a typical U.S. Gulf Coast anticline structure, in Energy Procedia, v. 4, Proceedings of 10th International Conference on Greenhouse Gas Control Technologies GHGT10, September 19–23, Amsterdam, The Netherlands, p. 3486–3493.
Choi, J.-W., Nicot, J.-P. Hosseini, S. A., Clift, S. J., and Hovorka, S. D., 2013, CO2 recycling accounting and EOR operation scheduling to assist in storage capacity assessment at a U.S. gulf coast depleted reservoir. Int. J. Greenhouse Gas Control (2013), http://dx.doi.org/10.1016/j.ijggc.2013.01.033
Delshad, Mojdeh, Kong, Xianhui, Tavakoli, Reza, Hosseini, S. A. Wheeler, M. A., 2013., Modeling and simulation of carbon sequestration at Cranfield incorporating new physical models. Int. J. Greenhouse Gas Control (2013), http://dx.doi.org/10.1016/j.ijggc.
Doughty, Christine, and Freifeld, Barry, in review, Modeling CO2 injection at Cranfield Mississippi, Inversion of methane and temperature effects.
Hosseini, S.A., Lashgarib, Hamidreza, Choi, J.-W., Nicot, J.-P., Ju, Jiemin, Hovorka, S. D, 2013., Static and dynamic reservoir modeling for geological CO2 sequestration at Cranfield, Mississippi, U.S.A. Int. J. Greenhouse Gas Control (2012), http://dx.doi.org/10.1016/j.ijggc.2012.11.009
Hosseini, S. A., and Nicot, J. -P., 2012, Numerical modeling of a multiphase water oil CO2 system using a water–CO2 system: application to the far field of a U.S. Gulf Coast reservoir: International Journal of Greenhouse Gas Control, v. 10, p. 88–99.
Kim, Seunghee, and Hosseini, S. A., 2013, Above-zone pressure monitoring and geomechanical analysis of a field scale CO2 injection, Cranfield Mississippi, Greenhouse Gases Science and Technology, Wiley Online Library (wileyonlinelibrary.com). DOI: 10.1002/ghg.1388
Lu, J., Cook, P. J., Hosseini, S. A., Yang, C., Romanak, K. D., Zhang, T., Freifeld, B. M., Smyth, R. C., Zeng, H., and Hovorka, S. D., 2012, Complex fluid flow revealed by monitoring CO2 injection in a fluvial formation: Journal of Geophysical Research, v. 117, B03208, doi:10.1029/2011JB008939.
Mukhopadhyay, S., Birkholzer, J. T., Nicot, J. -P., and Hosseini, S. A., 2012, A model comparison initiative for a CO2 injection field test: an introduction to Sim-SEQ: Environmental Earth Science, v. 67, p. 601–611.
Risk and well performance
Meckel, T.A., Zeidouni, Mehdi, Hovorka, S. D., Hosseini, S.A., 2013, Assessing sensitivity to well leakage from three years of continuous reservoir pressure monitoring during CO2 injection at Cranfield, MS, USA. Int. J. Greenhouse Gas Control (2013), http://dx.doi.org/10.1016/j.ijggc.2013.01.019
Nicot, J.-P., Oldenberg, C. M., Houseworth, J. E., Choi, J.- W, 2013 Analysis of potential leakage pathways at the Cranfield, MS, U.S.A., CO2 sequestration site. Int. J. Greenhouse Gas Control (2012),http://dx.doi.org/10.1016/j.ijggc.2012.10.011
Tao, Qing, Bryant, S. L., Meckel, T. A., 2013., Modeling above-zone measurements of pressure and temperature for monitoring CCS sites. Int. J. Greenhouse Gas Control (2012), http://dx.doi.org/10.1016/j.ijggc.2012.08.011
Geochemical studies of fluid response
Studies of the geochemical response to the CO2 injection found CO2–mineral reaction produced only small changes, however, exsolution of methane as a result of CO2 dissolution was identified for the first time.
Hosseini, S. A., Mathias, S. A., and Javadpour, F., 2012, Analytical model for CO2 injection into brine aquifers containing residual CH4: Transport in Porous Media, v. 94, p. 795–815.
Lu, Jiemin, Kharaka, Y. K., Thordsen, J. J., Horita, J., Karamalidis, A., Griffith, C., Hakala, J. A., Ambats, G., Cole, D. R., Phelps, T. J., Manning, M. A., Cook, P. J., and Hovorka, S. D., 2012, CO2–rock–brine interactions in Lower Tuscaloosa Formation at Cranfield CO2 sequestration site, Mississippi, U.S.A.: Chemical Geology, v. 291, p. 269–277.
Verma, Sandeep, Oaks, C.S., Chugunov, N., Ramakrishnan, T. S., Hosseini, Hovorka, S.. 2013, Reservoir fluid monitoring in carbon dioxide sequestration at Cranfield, Energy Procedia, 37, p. 4344–4355
Near surface groundwater monitoring
As expected, no impact from groundwater as a result of large volume injection at 10,000 ft depth was found. A push-pull test was used to identify the signal that would result if migration should occur.
Yang Changbing, Mickler, P. J , Reed Robert, Scanlon, B. R, . Romanak, K. D., Jean-Philippe Nicot J.-P.,. Hovorka, S. D., Trevino, R. H., Larson, Toti, 2013, Single-well push–pull test for assessing potential impacts of CO2 leak-age on groundwater quality in a shallow Gulf Coast aquifer in Cranfield, Mississippi. Int. J. Greenhouse Gas Control (2013),
http://dx.doi.org/10.1016/j.ijggc.2012.12.030
Romanak, K. D., Bennett, P. C., Yang, C., and Hovorka, S. D., 2012, Process-based approach to CO2 leakage detection by vadose zone gas monitoring at geologic CO2 storage sites: Geophysical Research Letters, v. 39, L15405, doi:10.1029/2012GL052426.
Yang, Changbing, Romanak, Katherine, Holt, R. M., Linder, J., Smith, L., Treviño, R. H., Roecker, Frank, Xia, Y., and Rickerts, J., 2012, Large volume of CO2 injection at the Cranfield, early field test of the SECARB Phase III: near-surface monitoring, in Carbon Management Technology Conference, 7–9 February, Orlando, Florida, USA, SPE 163075 DOI: 10.7122/151428-MS.
2014 Updates
July 30, 2014—Update of Accomplishments at Cranfield
This is a base-line 3-D survey with interpreted structure on base Tuscaloosa, showing key units. The crestal graben fault is showing blue.
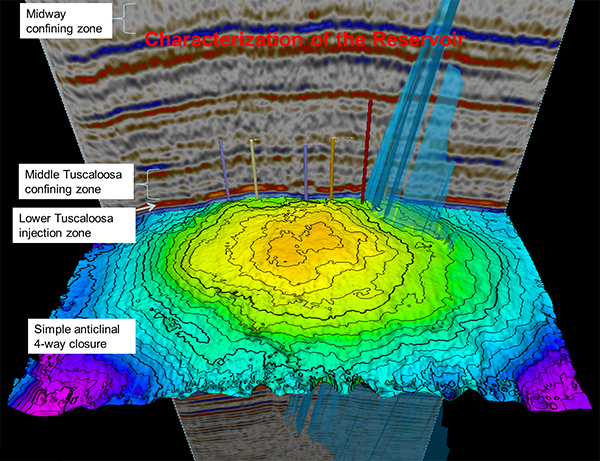
GCCC has participated in SECARB principally through leading a two-stage field experiment in monitoring at Denbury Onshore LLC's Cranfield field CO2 enhanced oil recovery (EOR) project. The first test program, known as Phase II, was conducted from 2008 to 2011 within the EOR injection-production patterns and tested the above-zone monitoring interval (AZMI) pressure monitoring as a surveillance tool to assess isolation. The second stage of testing, known as Phase III, or the SECARB "early test," assessed many elements of field-scale monitoring, such as reservoir pressure surveillance, wireline logging of the reservoir interval, 4D seismic surveillance of the reservoir and zones above it for change in fluid composition, AZMI pressure monitoring, groundwater geochemical sampling, and airborne magnetic and conductivity surveys. In addition, an intensive study was conducted at the detailed area of study (DAS), where two observation wells were placed 100 m downdip of an injection well in the water leg below the oil-water contact. An intensive multistage, multiresearcher effort was conducted to characterize the reservoir, monitor flow, and model the system response to CO2 injection at the DAS.
The GCCC-led SECARB projects at Cranfield have resulted in a number of accomplishments for the RCSP program:
- Monitored a large-volume injection (5 million metric tons CO2 stored).
- Monitored at a commercial EOR site.
- Monitored over a very long timeframe (2008–14).
- Provided information about the feasibility and limitations of common monitoring approaches such as 4D seismic surveillance and groundwater geochemical testing programs.
- Created highly collaborative opportunity for industry, national lab, U.S. Geological Survey, and academic interaction. Hosted many experiments within and outside of the RCSP, such as the National Risk Assessment Partnership (NRAP), the Carbon Capture Project (CCP), GEO-SEQ, the Center for Frontiers of Subsurface Energy Security (CFSES), and other targeted projects.
- Provided dense data that can be used for capacity assessment.
- Published numerous results (see list of references below).
- Led the way toward the next phase of more commercially oriented monitoring.
In addition, significant R&D was undertaken as part of this study:
- The second geologic CO2 storage tests of cross-well electrical resistivity tomography (ERT) for detection of CO2 substituting for brine were performed. (The first was the small shallow deployment at Ketzin, Germany.) The favorable outcome showed good sensitivity, even with significant noise from the instruments, and possible sensitivity to increases in saturation beyond the range of seismic detection.
- The second geologic CO2 storage tests of gravity (after the seafloor gravity measurement at Sleipner, North Sea) were performed. The wellbore instrument was able to detect and reasonably quantify CO2 substitution for brine. This work was done as part of CCP.
- Exsolution of methane from brine as a result of CO2 dissolution was observed.
- The complexities of interaction between reservoir heterogeneity and injection rate in the two-phase-flow field were documented. Efficiency of occupancy was dependent on injection rate.
- This project supported development and demonstration of the process-based soil
gas method for attribution of the source of anomalies. This method is sensitive to very small (insignificant) fluxes. (See Natural Analog Studies Theme for more.) - No microseismicity was detected from the injection. This work was done as part of the Research Institute of Innovative Technology for the Earth (RITE).
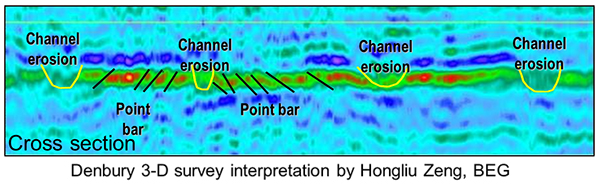
Colors in the 3-D seismic map flattened on the lower Tuscaloosa D-E show sand in brighter colors and lower quality reservoir in blue-green, with methane gas in the yellow colors. Interpreted stratigraphic cross section showing depositional facies.
Complex responses of many parts of the system during monitoring led to difficulty in uniquely matching fluid-flow models to observation. Also, observed limitations on detectability of response—for example, inability to reliably "map the plume edge" above noise using 4D surface seismic or vertical seismic profiling (VSP)—are important outcomes in terms of regulatory expectations. This finding leads to the development of the concept of assessment of low-probability material impacts (ALPMI) described in the EPA–CCS site-specific sensitivity study, where neither continually updated history match nor comprehensive monitoring of plume movement is needed. The ALPMI method requires assessment of the material impacts and the signal that would precede the impact, and designs monitoring to intercept the unacceptable low-probability reservoir responses. Use of modeling becomes primarily an up-front activity, which only needs updating if major flaws are observed that potentially lead to project failure.
Another outcome of observations at Cranfield is that near-surface monitoring requires deep and substantive characterization if it is to be effectively used to show no change during and after injection. Many changes are already under way in near-surface settings, and changes in climate, development, or recovery from past use are expected. We recommend careful characterization of the near surface to identify (1) the natural range and trend of variability and (2) the response of the system should it be perturbed as a result of injection. For example, the signal produced should CO2, brine, or other fluids migrate from the reservoir to shallow depths or the surface. We do not recommend that groundwater soil gas be systematically sampled with the expectation of detecting a signal if, as expected, the noise is high and complex. These data are valuable should an unexplained change occur so that project personnel can determine if the response is a result of injection.
2013 Updates
October 28, 2013—Featured Publication
A special section of the October issue of the International Journal of Greenhouse Gas Control is dedicated to CCS work at Cranfield Field, Mississippi. The section comprises a mid-project overview and assessment of the CCS field work, dense data collection, and analysis that began a decade ago with the formation of the Southeast Regional Carbon Sequestration Partnership and that continues today at Cranfield Field. The section consists of sixteen papers authored by GCCC staff and their colleagues. It opens with a discussion of the Cranfield project design and covers risk assessment, characterization, injection and production activities, as well as monitoring techniques and modeling.
The publication of this collection of papers is a gratifying milestone for the GCCC. The volume was guest-edited by Susan Hovorka, Tip Meckel and JP Nicot. Nicot commented, "This is the first exhaustive document of the Partnership's projects, and it will be useful to the entire CCS community."
February 2013—Update of Accomplishments at Cranfield
Four million metric tons of CO2 have been stored at Cranfield over the past 4 years. This is an important demonstration that large scale CO2 injection is a viable and commercially available technology. Note: Recycling of CO2 at the field for EOR is 6.5 million metric tons, so the 4 million tons of CO2 stored represents actual saline storage.
Modeled lab, and field tests have simulated leakage to groundwater to define the signal that would be detected should this occur. Monitoring of Cranfield groundwater by BEG, Ol' Miss and Mississippi State have detected no CO2 related change to groundwater even in an area with many dozens of 1940s era wells, and plugged and abandoned (P&A) wells.
Pressure in Cranfield field has been elevated above hydrostatic (natural pressure) as much as 1200 psi, which is not insignificant. Microseismic monitoring by RITE (Japan) has detected no microseismicity. This is an important contribution in the context of concern about seismicity related to deep underground injection of CO2.
2012 Updates
August, 2012—Like Champagne Bubbles in the Wellbore
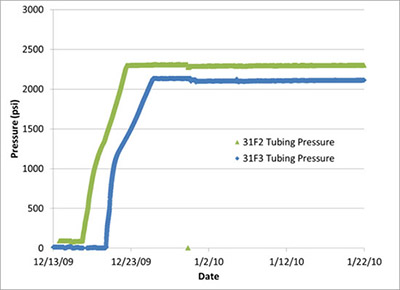
Pressure increases as CO2 bubbles fill the observation wells. The bubbling takes 3-4 days.
We are assessing a new and elegantly simple technique to study the timing and chemical composition of breakthrough. This work was primarily developed by GCCC's Seyyed Hosseini and Sandeep Verma of Schlumberger.
At breakthrough, supercritical carbon dioxide first enters the well-bore. Because CO2 is lower density than the surrounding brine (about 0.6 compared to 1.1 g/cm3), bubbles of CO2 form and rise to the top of the well, just like bubbles in a champagne flute. The first bubbles to arrive at the top of the well contain the first breakthrough fluid. The next bubbles record the chemical composition of the next bit of fluid, and so on. If the well is shut-in, the bubbles rise in the well-bore and collect in a narrow tubing in which mixing is suppressed. From the top down, the collected fluid represent a time series of breakthrough chemistry.
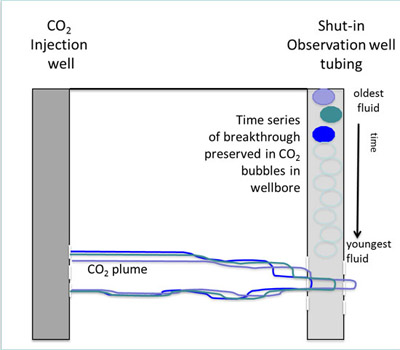
Sampling fluid in the shut-in well bore allows for a one-time effort rather than continuous monitoring.
As a part of the final monitoring program at Ella G. Lees #7 (the Phase II observation well), we assessed the wellbore fluid in order to assess CO2-methane ratio at breakthrough. Reservoir fluid has not been sampled at this well. The Schlumberger Platform Basic Measurement Sonde (PBMS) measures wellbore pressure and temperature, and the Platform Gradiomanometer Sonde (PGMS) measures high resolution average density. Schlumberger-Doll labs analyzed the density of the wellbore fluid. We combined fluid density information calculated by subtracting bottom-hole pressure and temperature from surface pressure and temperature. This provides breakthrough composition data in the same way that on-site sampling with a U-tube does but a lower cost.
The timing of breakthrough can be easily resolved from change in rate of change of tubing pressure at the wellhead. Prior to breakthrough the wellbore is filled with brine. As the CO2 fills the idle tubing, pressure gauges at the wellhead record increase change of pressure as a result of the more less dense supercritcal CO2 displacing the dense brine. This method has been previously validated by comparison of real-time sampling at the DAS. Fluid composition was measured with the U-tube during breakthrough at the observation well F2, which is closer to the injector and began to fill with CO2 on December 16, as evidenced by the increased pressure at the wellhead. Breakthrough began at the second observation well F3 three days later. After the wellbores filled with low-density CO2, the pressure remained high and constant as shown in the graph.
August, 2012—Update of Activities at Cranfield
At Cranfield Field, long-term and time-lapse surveillance of carbon dioxide injection continues, as does data analysis, presentation, and discussion. A special volume of the International Journal of Greenhouse Gas Control Technologies focused on Cranfield results is in preparation.
In order to assess risk and signal from unexpected CO2 leakage to fresh water, we have completed a first-of-its-kind push-pull test to test CO2 interaction with aquifer mineralogy and water under in-situ conditions. Aquifer water was produced, saturated with CO2, and reinjected in a closed look. Reacted brine was withdrawn and analyzed for chemical and isotopic composition. This work is being conducted partly under funding from the American Water Works Association (AWWA).
GCCC student Julie Ditkof traveled to Curtain University in Perth, Australia to improve the 4-D seismic signal using time-lapse cross-equalization. The work attempts to improve CO2 signal in this deep, thin, and complex reservoir.
The Research Institute of Innovative Technology for the Earth (RITE) started collecting data from a recently installed 6-site microseismic array over the whole Cranfield field (in collaboration with WESTCARB). The seismic array is now operational and, while it has recognized distant events, no local seismic events have been detected, however noise from unidentified sources has been noted. The objective of the project is to develop experience with prediction and monitoring methods for microseismicity related to CO2 injection.
The cumulative total stored CO2 mass monitored at Cranfield at the end of the quarter has reached 3,565,107 metric tons. Cranfield is the first of the DOE's Storage Partnerships to exceed its storage goals.
2011 Updates
May 3, 2011—Annual Conference on Carbon Capture and Sequestration
Katherine Romanak presented results from soil-gas monitoring work at Cranfield's P-site at the 10th Annual Conference on Carbon Capture and Sequestration in Pittsburgh, PA. To view the complete poster, "Method for Distinguishing Signal From Noise in the Near-Surface Using Simple Soil-Gas Measurements: Lessons from Natural and Industrial Analogues", please click here.
2010 Updates
May 6–8, 2010—Monitoring Network Meeting
Download full video in Quicktime (142 Mb) or reduced Animated GIF (12.5 Mb)
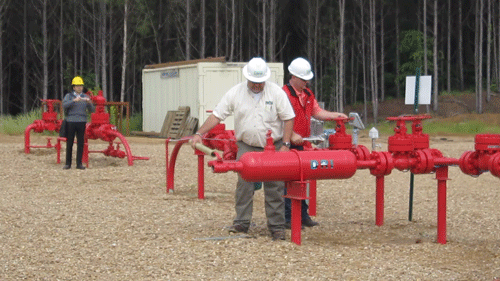
The GCCC sponsored a Monitoring Network meeting of the International Energy Agency Greenhouse Gas R&D Programme at Cranfield. During the meeting, engineers demonstrated the venting of CO2 from injection equipment. CO2 is colorless, but it appears as a white stream because it cools rapidly from very high temperature to ambient temperature, which causes water from the air to condense. These water droplets scatter light so that the stream appears white. The force of the release also demonstrates the high pressure at which CO2 is injected into containment systems.
April and May, 2010—Tracer Monitoring Test at Cranfield
Researchers of Gulf Coast Carbon Center, Laurence Berkley National Lab, US Geological Survey, Oak Ridge National Lab, and University of Edinburgh conducted a reservoir fluid sampling and tracer monitoring program at Cranfield field, Mississippi. Production wells under CO2 flood were sampled to understand CO2 -related water-rock reactions and their impact on organic chemistry. Tracers consisting of krypton, xenon, a suite of perfluorocarbons, and sulfur hexafluoride were introduced to the CO2 stream of the injector at Detailed Area of Study (DAS). The tracers were detected in the two monitoring wells by frequent sampling using U-tube systems. Two such tracer tests were conducted at different CO2 injection rates. The collected datasets shed light on fluid migration rates and evolution of pathways in the injection zone.
March 7–10, 2010—GCCC Collaborates with Department of Energy's National Energy Technology Laboratory (DOE NETL) on CO2-Rock-Water Interaction Experiments
GCCC's Jiemin Lu traveled to NETL in Pittsburgh to work with scientists who have developed two autoclave reactors to study rock-water interactions. The system precisely controls both temperature and pressure to carefully replicate the conditions that occur deep underground in the formations used for geologic sequestration of carbon dioxide.
The system's inner vessel is a gold bag that serves as the reaction container. Brine and rock samples are sealed in this bag. One tube is connected to allow water sample to be taken during the reaction. The gold bag is then placed inside a steel container, which is filled with water. Pressure is applied to the water to change the pressure inside the gold bag. The entire apparatus is placed in a heat chamber, which controls the temperature. The system is closed, so that the samples are never exposed to oxygen or atmospheric pressure.
Lu's initial experiment will involve Tuscaloosa sandstone and brine collected from the U-tube at Cranfield field during the SEACARB III experiments. Rock and brine will equilibrate for one month, after which CO2 will be added to the system to simulate injection of carbon dioxide. Samples of brine will be taken periodically to study changes in acidity, concentrations of anions and cations, redox, and isotopes.
Lu explains that the study will both "help refine our questions and bound model conditions," providing new insights into the interactions that occur during geological sequestration.
2009 Updates
December 25, 2009—Holiday Season at Cranfield
GCCC scientists maintained an around the clock work schedule throughout the holidays, monitoring the development of the injection experiment. For the full story, click here.
December 6, 2009—Tour of P-Site
Katherine Romanak hosted a tour of P-site, which is the study site established by GCCC for determining how environmental factors affect near-surface monitoring at an engineered location. Romanak demonstrated methods used by BEG scientists to monitor the site and showed the scientists the first soil-gas data set that collected. The scientists discussed preliminary interpretations of the data, as well as numerous areas for future collaboration.
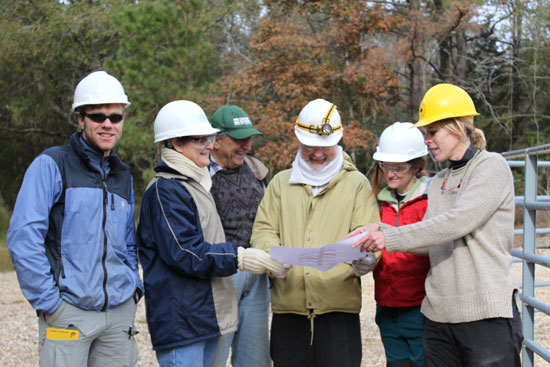
The visitors to the P-site are (from left to right) Stuart Gilfillan (University of Edinburgh, Scotland) Susan Pfiffner (University of Tennessee) Yousif Kharaka (U.S. Geological Survey, Menlo Park, California) Tommy Phelps (Oak Ridge National Laboratory) Kim Gilbert (Ph.D. student, The University of Texas at Austin) and GCCC's Katherine Romanak.
December 5, 2009—First Week of Injection at SECARB III: Detailed Area of Study (DAS)
We have begun injection in the Detailed Area of Study (DAS) of the SECARB project at Cranfield. The DAS consists of three wells drilled at close spacing: one injection well (CFU 31-F1) and two observation wells (CFU 31-F2 and CFU 31-F3). The spacing from F1 to F2 is 227 feet (69 m) and from F1 to F3 367 ft (111 m). The observation wells are east and downdip of F1. The three wells are completed in the lower Tuscaloosa with a 65 ft (20 m) perforated interval at a top average depth of 10,445 feet. The downdip is 1 to 2 degrees.
A dense array of subsurface instruments have been deployed in the DAS wells designed to: (1) test novel MVA (monitoring, verification, and accounting) tools and improve tool performance evaluation and (2) improve capacity assessment via measurement of saturation and sweep efficiency as a CO2 flood develops.
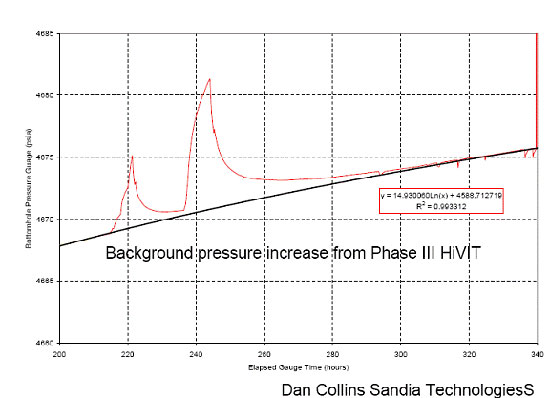
The background pressure in the DAS has been increasing as a result of injection in the high volume test at Cranfield
The instrumentation in the DAS wells allows us to simultaneously collect numerous physical measurements to assess the spatial extent and concentration of CO2. Electrical resistance tomography (ERT) receivers are installed on the casing, above-zone pressure gages, and distributed temperature sensors were installed on both F2 and F3. Baseline geophysical surveys requiring full well diameter, such as cross-well seismic measurements, gravity measurements, and VSP (vertical seismic profiles), were run several months ago prior to perforation. During tubing completion, additional tools were strapped onto the tubing and lowered into the wells, including reservoir pressure and temperature gages on wireline read-outs, tubing conveyed piezoelectric sources fabricated by LBNL (Lawrence Berkeley National Laboratory) in F2 and two receiver strings in F3. The installed seismic system is known as continuous active seismic source monitoring (CASSM).
The DAS is the last portion of the Phase III Early Test to start injection. Injection has been underway at wells to the north of the DAS since April as part of the Phase III high volume injection test (HiVIT). We have observed a relatively strong pressure increase in the DAS as a result of this injection.
In mid November, we completed a hydrologic interference test, which demonstrated that the wells are in good hydrologic continuity. We performed a step rate field brine injection into F1, during which the rate of brine injected into the well was repeatedly increased over time. We estimated that the permeability over the perforated interval is 216 mD at F1 and 411 mD at F2.
Pressure gauges have been collecting baseline data since early November. ERT began on November 26, 2009. ERT is returning consistent data, with some intermittent noise issues near the packer and in the F2 well. The theoretical depth of penetration of ERT in monopole mode is 4 meters away from the well. CASSM began operations incrementally and at first performed very well.
On November 30, 2009 the project collected the baseline pulsed neutron log Schlumberger Reservoir Saturation Tool (RST) in F2 and F1. F3 still contains dense workover fluid, that will be produced next week and baseline runs will be conducted at the same time as the first repeat in F2. F1 repeat RST will be at the same time as repeat cross well seismic, gravity, and VSP, as injection will continue into this well in the near term.
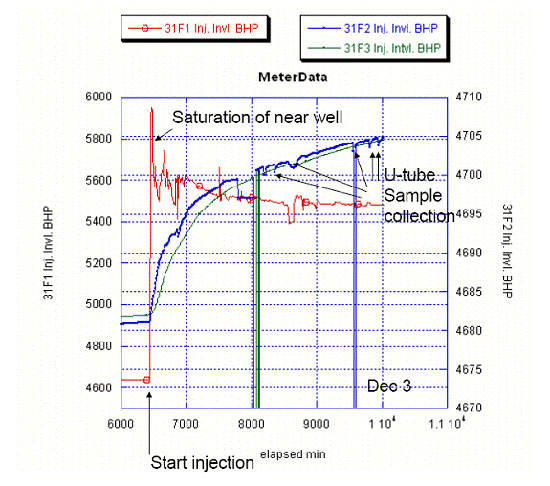
Following injection at well F1 (red), pressure at the F2 observation well (blue) and at the F3 observation well (green) increased as expected.
At 8:40 AM December 1, 2009, CO2 injection began into CFU 31 F1. The injection rate was initially set by a 10/64 choke on a needle valve at the wellhead to assess the well and formation response. The pressure in the reservoir responded immediately and as expected, stabilizing about 550 psi higher than the initial pressure. The pressure in F2 and F3 has been rising to about 25 psi above initial conditions.
As the well and near-well bore saturated and the back-pressure decreased over the first few hours, we stepped up the rate to 240 tons/day. This was determined to be a moderate rate for the experiment. We plan to step up the injection rate at this well over the next few weeks to double or more, and then step up rates at nearby wells to produce the Phase III million-ton-per-year rate.
A program of pulsed tracers including 5 PFT's, SF6, and Xe and Kr was introduced into the injection well CO2stream over the first 4 days of injection and will be repeated when the injection rate is increased. These tracers will be used to: (1) measure changes in velocity as the plume builds, (2) observe transport mechanism, and (3) estimate dissolution into brine.
To measure these tracer concentrations, we have developed a program of high frequency sampling employing the U-tube in-situ fluid sampler constructed by LBNL and operated in teamwork by the Bureau. Samples are extracted at a rate of one sample every 2 to 4 hours. The USGS operates an in-line high pressure pH meter. The tracer and gas composition of every sample is measured with an LBNL quadrupole mass spectrometer in the field, along with lab duplicates of selected samples.
As of December 5, 2009, the gas species measured in the U-tube is methane at concentrations consistent with dissolved phase, and no increase in CO2 or tracer has been detected. The USGS conducts additional assessments of selected samples for aqueous geochemistry. Baseline alkalinity of 370mg/L as HCO3 has been measured. Fluorescent dye placed in 900 barrels of injection brine at step-rate test has been detected at F2, confirming that the wells are in good connection for single phase transport. Rhodamine was used as a tag in workover water prior to perforation and is an indication of a contaminant that is present but of low quantity. The USGS is also resampling and adding to the HiVIT monitoring program.
The U-tube operation is staffed around the clock by a minimum of two staff per shift. Two additional geochemists are also processing samples. A site supervisor from Sandia Technology manages well issues, and the U-tube N2 and compressor issues on a 3 to 5 days/week schedule. This schedule will continue though arrival of the last tracer estimated to occur mid January. Denbury provides 24-hour oversight of injection.
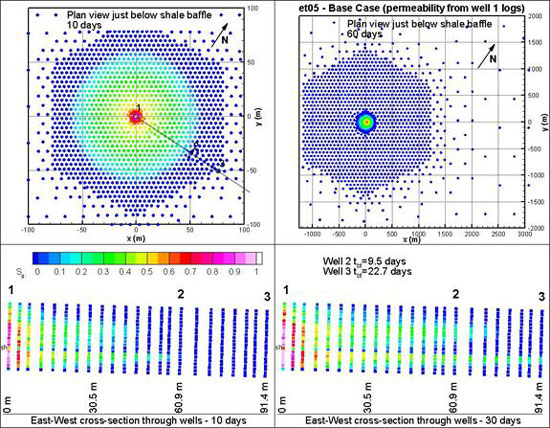
Example model result prepared by Christine Dougty, LBNL using TOUGH 2 showing the spatial extent of carbon dioxide 10 and 30 days after the initiation of injection. The model predits breakthrough at F2 after 9.5 days and F3 after 22.7 days
BEG and LBNL have recently completed several models using our new data to estimate the time it will take CO2 to move from F1 to F2 and then F3. The model results are sensitive to saturation and sweep efficiency (the variables that the experiment is designed to assess), also to assumptions about interaction of pressure and gravity on transport. The modeling provides a range of estimates of plume building performance. The fastest estimate of breakthrough (detection of supercritical CO2 arrival at the F2 observation well) is 7 days, with an average of about two weeks. Our past experience during the Frio pilot injection tests showed breakthrough at the observation well on the early end of estimates. Therefore, we began the well-based detection programs prior to injection with gradually increasing intensity during the first week. The average estimated arrival time for F3 is January 4, 2010
October 13, 2009—Instrumentation Installed at Soil-Gas Monitoring Site
GCCC researchers Changbing Yang and Katherine Romanak continue their work to understand how soil-gas monitoring can best be used to document storage effectiveness. The study site at Cranfield has a suite of the complexities that must be studied and analyzed in order to separate any possible subsurface-sources leakage signal from background variability. These complexities include a constructed gravel pad that contains a plugged and abandoned (P&A) oil well and a 1950's era pit filled with water and possibly some legacy hydrocarbons. The entire area is surrounded by forest, and the plants are expected to play an important role in the dynamics of carbon dioxide and other gases in the area. The relative importance of the contribution of the pad, the pit, and the plants will be assessed in our analysis, so we therefore refer to the site as the P-site. The Jackson School of Geosciences at the University of Texas generously provided matching funding to GCCC for the instrumentation.
Romanak and Yang with the help of researcher Bob Reedy established four soil-gas monitoring transects within P-site to help distinguish the various influences of the pad, pit, plants, and P&A well on near-surface soil-gas compositions as shown in the diagram of the site.
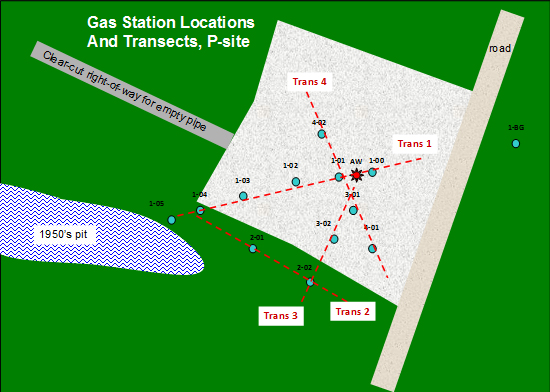
Schematic diagram of the P-site shows the locations of twelve soil- gas stations relative to the gravel pad, the P&A well, and the mud pit.
Each transect is composed of three to six soil-gas stations. A single soil-gas station includes three 1/8-inch stainless steel gas wells with 6-inch screens set at depths ranging from 2 to 15 feet. The wells are packed with sand in the regions where gas is to be sampled and bentonite clay between sample regions. In addition, a soil-gas well was installed in the detailed area of study (DAS).
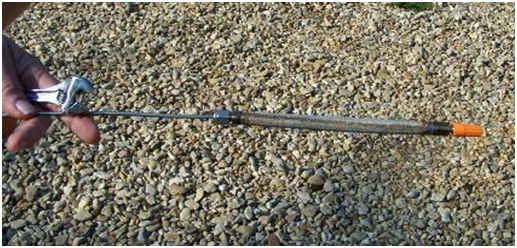
A soil-gas well is constructed of 1/8 inch stainless steel tubing and fitted with a 6-inch screen for sampling of gas. These types of wells are permanently installed at various depths within one gas station.
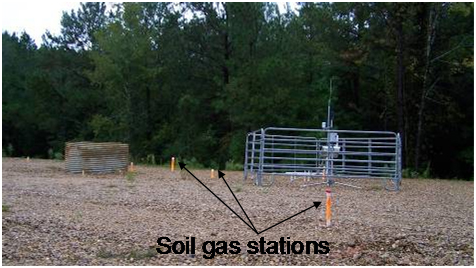
PVC protector pipes emerging from the ground at P-site indicate the locations of soil-gas stations.
Sediment samples were collected from the soil-gas stations. They have been brought back to the lab at GCCC where they will be analyzed for water content, matric potential (an indicator of the potential of water to move through soils), bulk density, organic matter, and texture. These measurements will be used in modeling of the movement of gases at the P-site.
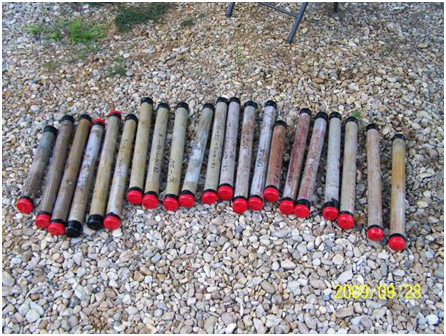
Sediment samples were collected in clear plastic tubes. The different colors visible through the tubes suggest significant complexity of the soils at P-site. The orange and reddish colors may indicate oxidation and reductive processes.
A near-surface observatory, an integrated system for continuously connecting above- and below-ground information was also installed at the P-site. The observatory collects above-ground information, such as air temperature, barometric pressure, precipitation, air CO2 concentration, solar radiation, wind speed and directions, and relative humidity and also subsurface data including soil water content, matric potential, temperature, and soil CO2 concentration at different depths. A solar panel provides power to the observatory. Data from the observatory and soil gas stations will also be used for numerical modeling exercises.
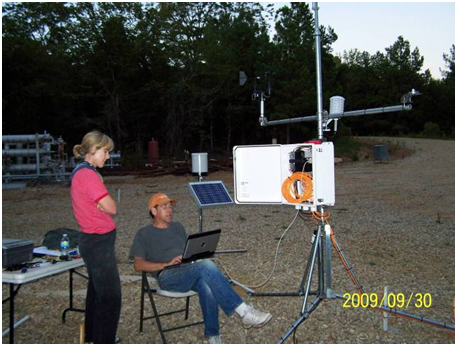
Romanak and Reedy program the data collection system to continuously collect measurements at the weather observatory.
A water well with a depth of 34 feet was also drilled at the P-site. The diameter of the borehole was 3 inches. It was completed with 1-inch diameter PVC pipe with 10 feet screen at the bottom. The depth of the water level at P-site is around 30 feet. This is a perched aquifer, as the regional aquifer used for industrial and domestic water supply is roughly 200 to 300 feet below the ground surface.
September 21, 2009—Geomechanical Test begins at Cranfield
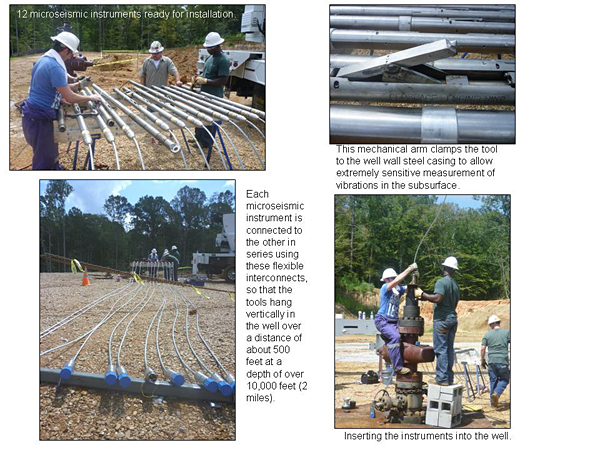
With his colleagues at the GCCC, Lawrence Berkeley National Laboratory, and Weston Geophysical, Tip Meckel recently initiated a subsurface geomechanical experiment at Cranfield. The study site for the project is approximately one mile from the DAS site and contains an observation well located about 1,200 feet from an injection well.
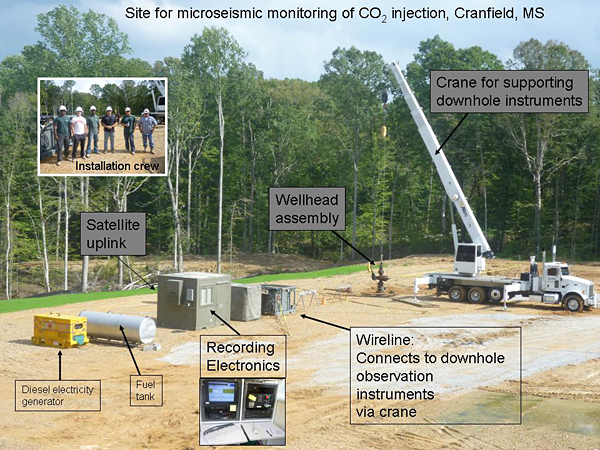
The observation well is equipped with downhole tool string on which twelve high-resolution geophones are attached. As CO2 is pumped into the injection well, pressure will increase as anticipated in the subsurface formations. The geophones will continuously monitor for and record any deep-subsurface small-scale acoustic signals that are generated within the injection reservoir and overlying seals. The number and frequency of the acoustic signals will indicate how changes in pressure affect the rock formations.
The new equipment at the Mudrocks System Research laboratory that is being used for sample analysis includes a large silver spray dryer, which produces truly random powder samples. The rectangular black equipment on the bench on the left is McCrone MicroNizing mill.
Last Updated: April 1, 2025