WaterRF Project: Task 1.0
Laboratory Batch Experiments
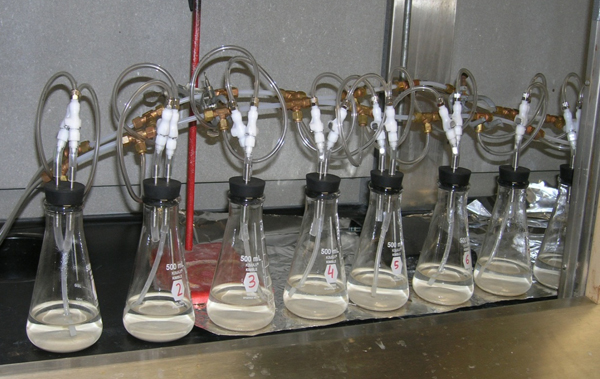
Figure 5. Photo of laboratory set up of the batch experiment for the Helena site.
Laboratory Batch Experiments Laboratory batch tests were conducted using sediments from two field sites to evaluate impacts of CO2 interaction with sediments and potential release of different elements. The field sites include the Helena site in the Texas Gulf Coast and the Cranfield site in Mississippi. Sediment samples taken from the field's target aquifers were pulverized and sieved. We choose pulverized rock sediments with the same particle sizes for batch reactions. Surface area of sediment samples were calculated on the basis of particle sizes. Prior to conducting the batch experiments, we characterized the solid phase more accurately using x-ray diffraction (XRD) and scanning electron microscopy (SEM). CO2 pressure was maintained at a constant level throughout each test. During the experiment, water samples were collected and analyzed to monitor chemical changes. At the end of the experiment, the solid phase will be examined to determine whether mineral dissolution is evident using SEM.
The inlet and outlet of the system shown in Figure 5 were controlled by a data logger which was set to purge gas for 1 minute every 20 minutes. The flasks were purged with high purity Ar gas for 5 days and then 20 mL of water was taken for chemical analysis (time=0). The Ar tank was replaced with a CO2 tank and CO2 gas was bubbled into the system with the same frequency as the Argon gas bubbling. It is worth noting that nine flasks were used with the same sediments and groundwater in our experiment, different than those reported in (Lu et al., 2010) and (Little and Jackson, 2010) because with nine flasks, water samples could be taken from one or two of the 9 flasks to minimize changes in water volume in a flask and avoid taking too much water from one flask which may affect water-rock-CO2 interactions in the flask. After CO2 was bubbled into the system, about 5 mL of water was taken from each of the nine flasks at different times. Values of pH were measured immediately after sampling using an Orion 3 pH-meter. The electrode was calibrated daily with buffer solutions at pH of 4, 7 and 10. Alkalinity was measured by titration of a sample aliquot with 0.16 or 1.6 N H2SO4.
XRD analyses of the sediments obtained from the Helena aquifer indicate that the aquifer sediments consist mainly of quartz (64.3%), microcline (24.8% in weight), illite 5.1%, and albite 5.9%. Trace amount of calcite were also found contained in the sediments (~0.04%). The BET surface areas of the Helena aquifer sediment is 14.42 m2/g.
Values of pH significantly decrease after CO2 was bubbled into the water-rock system and then gradually increased slowly with time (Figure 6).
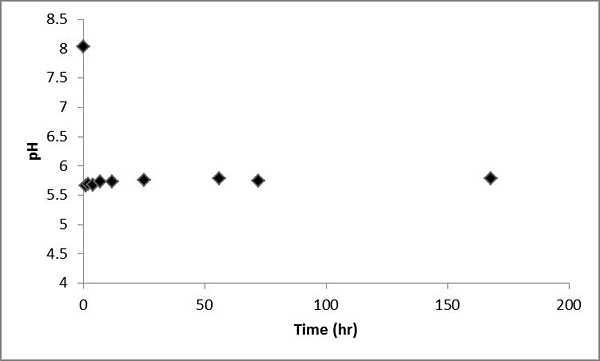
Figure 6. Values of pH measured for the batch experiment of the Helena aquifer sediments
Measured groundwater alkalinity increased from 100 mg HCO3/L to 450 mg/L and eventually reached steady state (Figure 7).
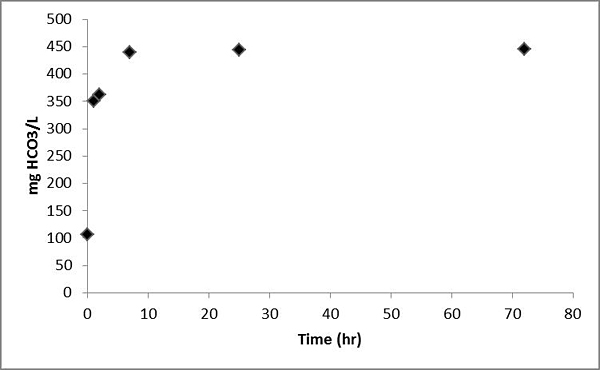
Figure 7. Alkalinity as HCO3 measured for the batch experiment of the Helena aquifer sediments
Concentrations of Mg and Ca increase with time within several days and then reach steady state (Figure 8).
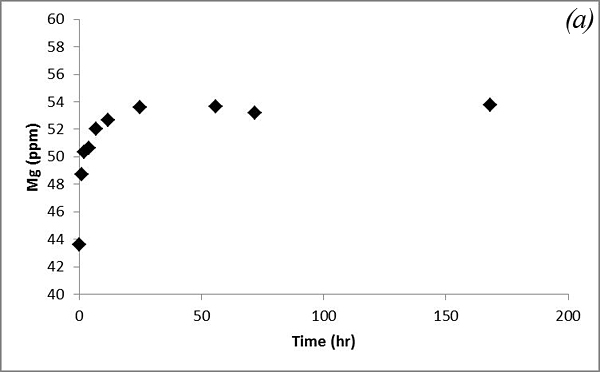
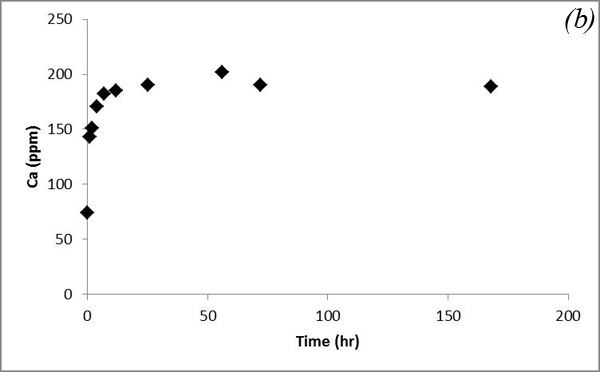
Figure 8. Concentrations of (a) Mg and (b) Ca measured in the batch experiment with the Helena aquifer sediments
This increasing trend is attributed to dissolution of carbonates contained in the sediments after CO2 gas was bubbled into the system. Na and K concentrations show some variations after CO2 was bubbled into the system (Figure 9).
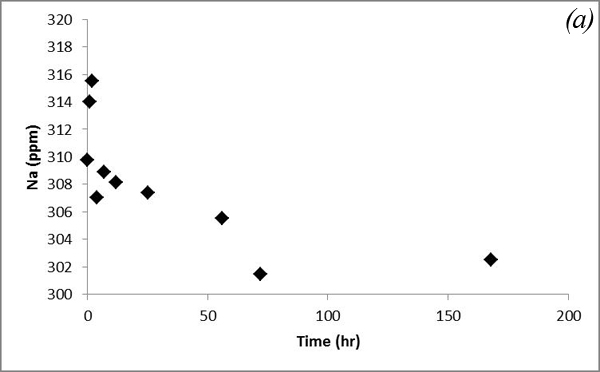
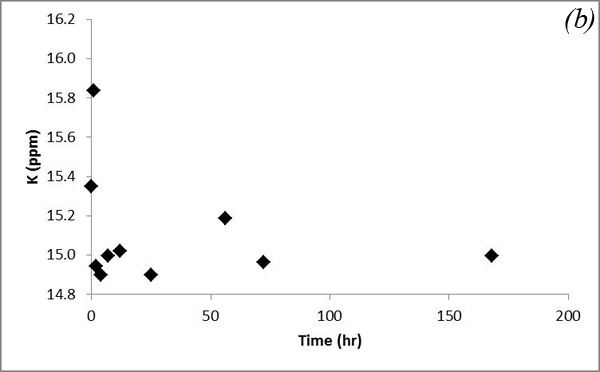
Figure 9. Concentrations of (a) Na and (b) K versus time in the batch experiment with the Helena aquifer sediments
It is interesting to note that Si concentrations show an overall increase in the first several days and then become stable. Increase in Si concentrations suggests silicate mineral dissolution. However, Na and K concentrations didn't show a corresponding increasing trend (Figure 10).

Figure 10. Concentrations of Si versus time in the batch experiment with the Helena aquifer sediments
This may be due to adsorption/desorption or cation exchange reactions. Concentrations of As and V decrease after CO2 was bubbled into the system and behave similarly (Figure 11).
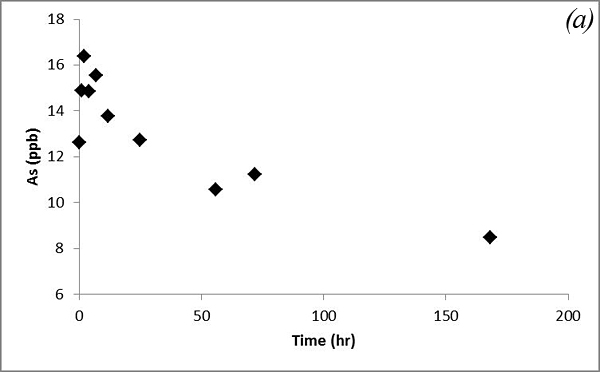
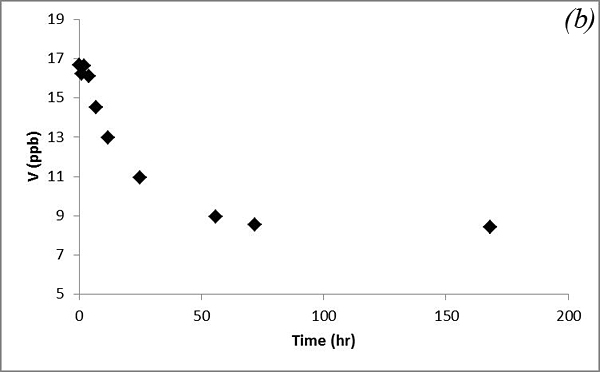
Figure 11. Concentrations of (a) As and (b) V versus time in the batch experiment with the Helena aquifer sediments
This decreasing trend is attributed to adsorption processes. Concentrations of U and Mn show an overall increasing trend, which is similar to that of Ca and Mg (Figure 12).
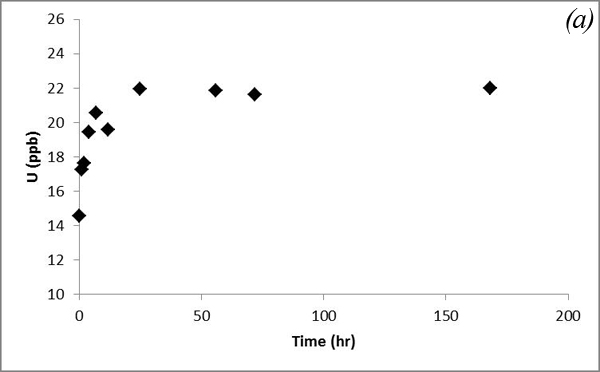
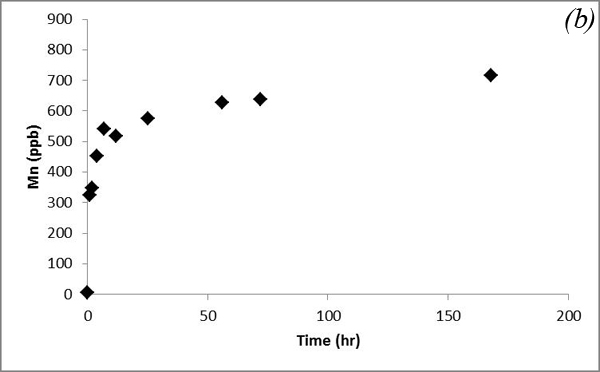
Figure 12. Concentrations of (a) U and (b) Mn versus time in the batch experiment with the Helena aquifer sediments
Such a trend is likely due to co-dissolution of carbonates. Iron concentration doesn't show an obvious trend after CO2 was bubbled into the system (Figure 13a). Concentrations of Pb, which was a major focus of research by Apps et al., 2009; 2010 do not vary significantly (Figure 13b).
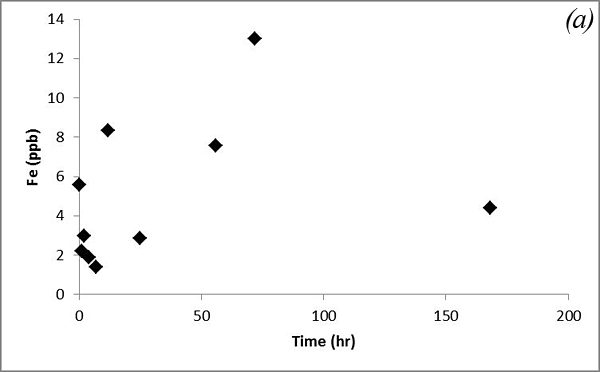
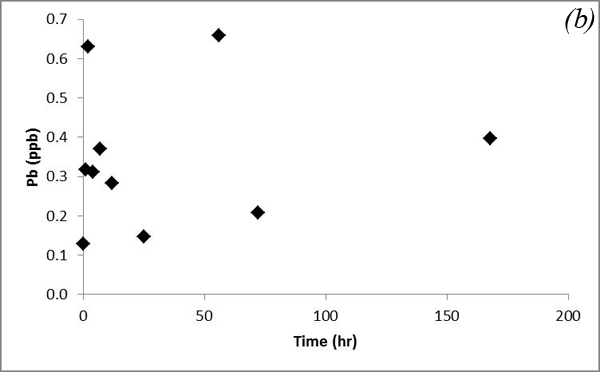
Figure 13. Concentrations of (a) Fe and (b) Pb versus time for the batch experiment of the Helena aquifer sediments
The following provides background information and the tasks.
- Program Overview
- Background
- Gulf Coast System
- Regulatory Issues
- Significance to Water Utilities
- Research Approach
- Task 1.0: Laboratory Batch Experiments
- Task 2.0: Modeling Design of Field Push-Pull Tests
- Task 3.0: Conduction of Push-Pull Tests in the Field
- Task 4.0: Modeling of Field Experiments
- Task 5.0: Communication
- References
- Quarterly Reports, Publications, and Data

