Lower Potomac Group, Eastern Coastal Plain (06)
Comments on Geologic Parameters
06 Continuity:
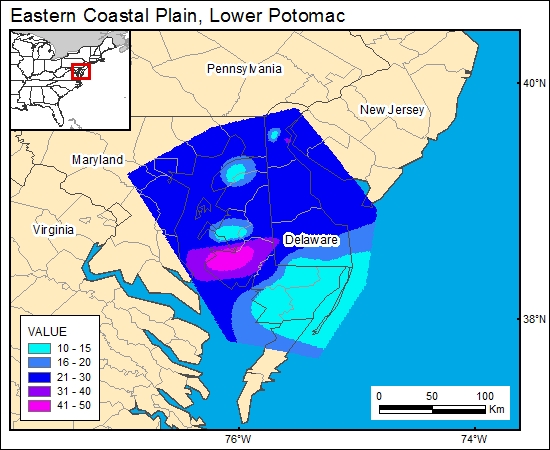
A number of studies present cross sections that include geophysical logs (gamma ray, spontaneous potential, resistivity) that can be used to evaluate sand-body continuity within the lower Potomac aquifer (Hansen, 1968; Brown and others, 1972; Cushing and others, 1973; Trapp and others, 1984). These cross sections indicate that a number of thicker sands are continuous. Cushing and others (1973, their plate 2) generated a map showing the thickness distribution of a major sand unit in the Potomac aquifer. This map, which is gridded for the GIS (c6potomacg), demonstrates that the major sand bodies are continuous, and for this particular interval, are more than 50 ft thick across the entire Delmarva Peninsula.
06 Map:

06 Reference:
Brown, P. M., Miller, J. A., and Swain, F. M., 1972, Structural and stratigraphic framework, and spatial distribution of permeability of the Atlantic coastal plain, North Carolina to New York: U.S. Geological Survey, Professional Paper 796, 79 p, 59 plates.
Cushing, E. M., Kantrowitz, I. H., and Taylor, K. R., 1973, Water resources of the Delmarva Peninsula: U.S. Geological Survey, Professional Paper 822, 58 p.
Hansen, H. J., 1968, Geophysical log cross-section network of the Cretaceous sediments of southern Maryland: Maryland Geological Survey Report of Investigation No. 7, 33 p.
Trapp, H., Jr., Knobel, L. L., Meisler, H., and Leahy, P. P., 1984, Test well DO-CE 88 at Cambridge, Dorchester County, Maryland: U.S. Geological Survey, Water-Supply Paper 2229, 48 p.


