St. Peter Sandstone, Illinois Basin (03)
Comments on Geologic Parameters
03 Formation Thickness:
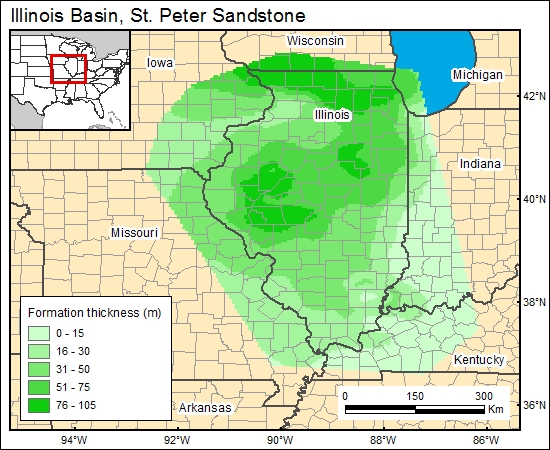
A number of published maps show the thickness distribution of the St. Peter Sandstones, including Hoholick (1980), Collinson and others (1988), and Kolata and Noger (1990). We chose to use the map of Collinson and others (1988) because it shows thickness at 50 (rather than 100) ft intervals. Kreutzfeld (1982) pointed out that the thickness of the St. Peter Sandstone is much more variable than the formation-thickness map indicates. The variation in thickness is due to postdepositional erosion and its highly irregular lower boundary. The base of the St. Peter Sandstone is a major regional unconformity (Collinson and others, 1988; Young, 1992b). The isopach was gridded (c3stpeterg).
03 Map:

03 Reference:
Collinson, C., Sargent, M. L., and Jennings, J. R., 1988, Chapter 14: Illinois Basin region, in Sloss, L. L., ed., The Geology of North America, v. D-2, Sedimentary Cover-North American Craton: U.S.: Decade of North American Geology: Geological Society of America, p. 383-426.


